Another one of the key Items which should be present in a notebook is a Gantt Chart. A Gantt Chart shows to judges, and others who read your notebook, that is a project that is not just thrown together it a few days (RI3D excluded). It allows you as a team to demonstrate proper project planning, allows you to delegate responsibilities early in the year, and gives those who are unfamiliar a general timeline for the year. This is directly from an the resource shown above, but does a great job better defining and describing the role of a Gantt Charts project development.
Descriptions from: https://www.teamgantt.com/what-is-a-gantt-chart
Additionally, there are many online free references which you can use to create a Gantt chart, or an Excel/Google Sheet would also work. Ultimately, it is up to you to find a method you prefer.
Gantt Charts
A gantt chart is a horizontal bar chart used in project management to visually represent a project over time. Gantt charts typically show you the timeline and status—as well as who’s responsible—for each task in the project.
In project management, gantt charts are used to schedule, track, and communicate deliverables, deadlines, dependencies, and resource assignments. They’re particularly helpful in managing complex projects with interdependencies that a simple to-do list or Kanban board can’t handle.
A gantt chart allows you to simplify complex projects into an easy-to-follow plan that includes:
- How a project breaks down into tasks
- When each task will begin and end
- How long each task will take
- Who’s assigned to each task
- How tasks relate to and depend on each other
- When important meetings, approvals, or deadlines need to happen
- How work is progressing in a project
- The full project schedule from start to finish
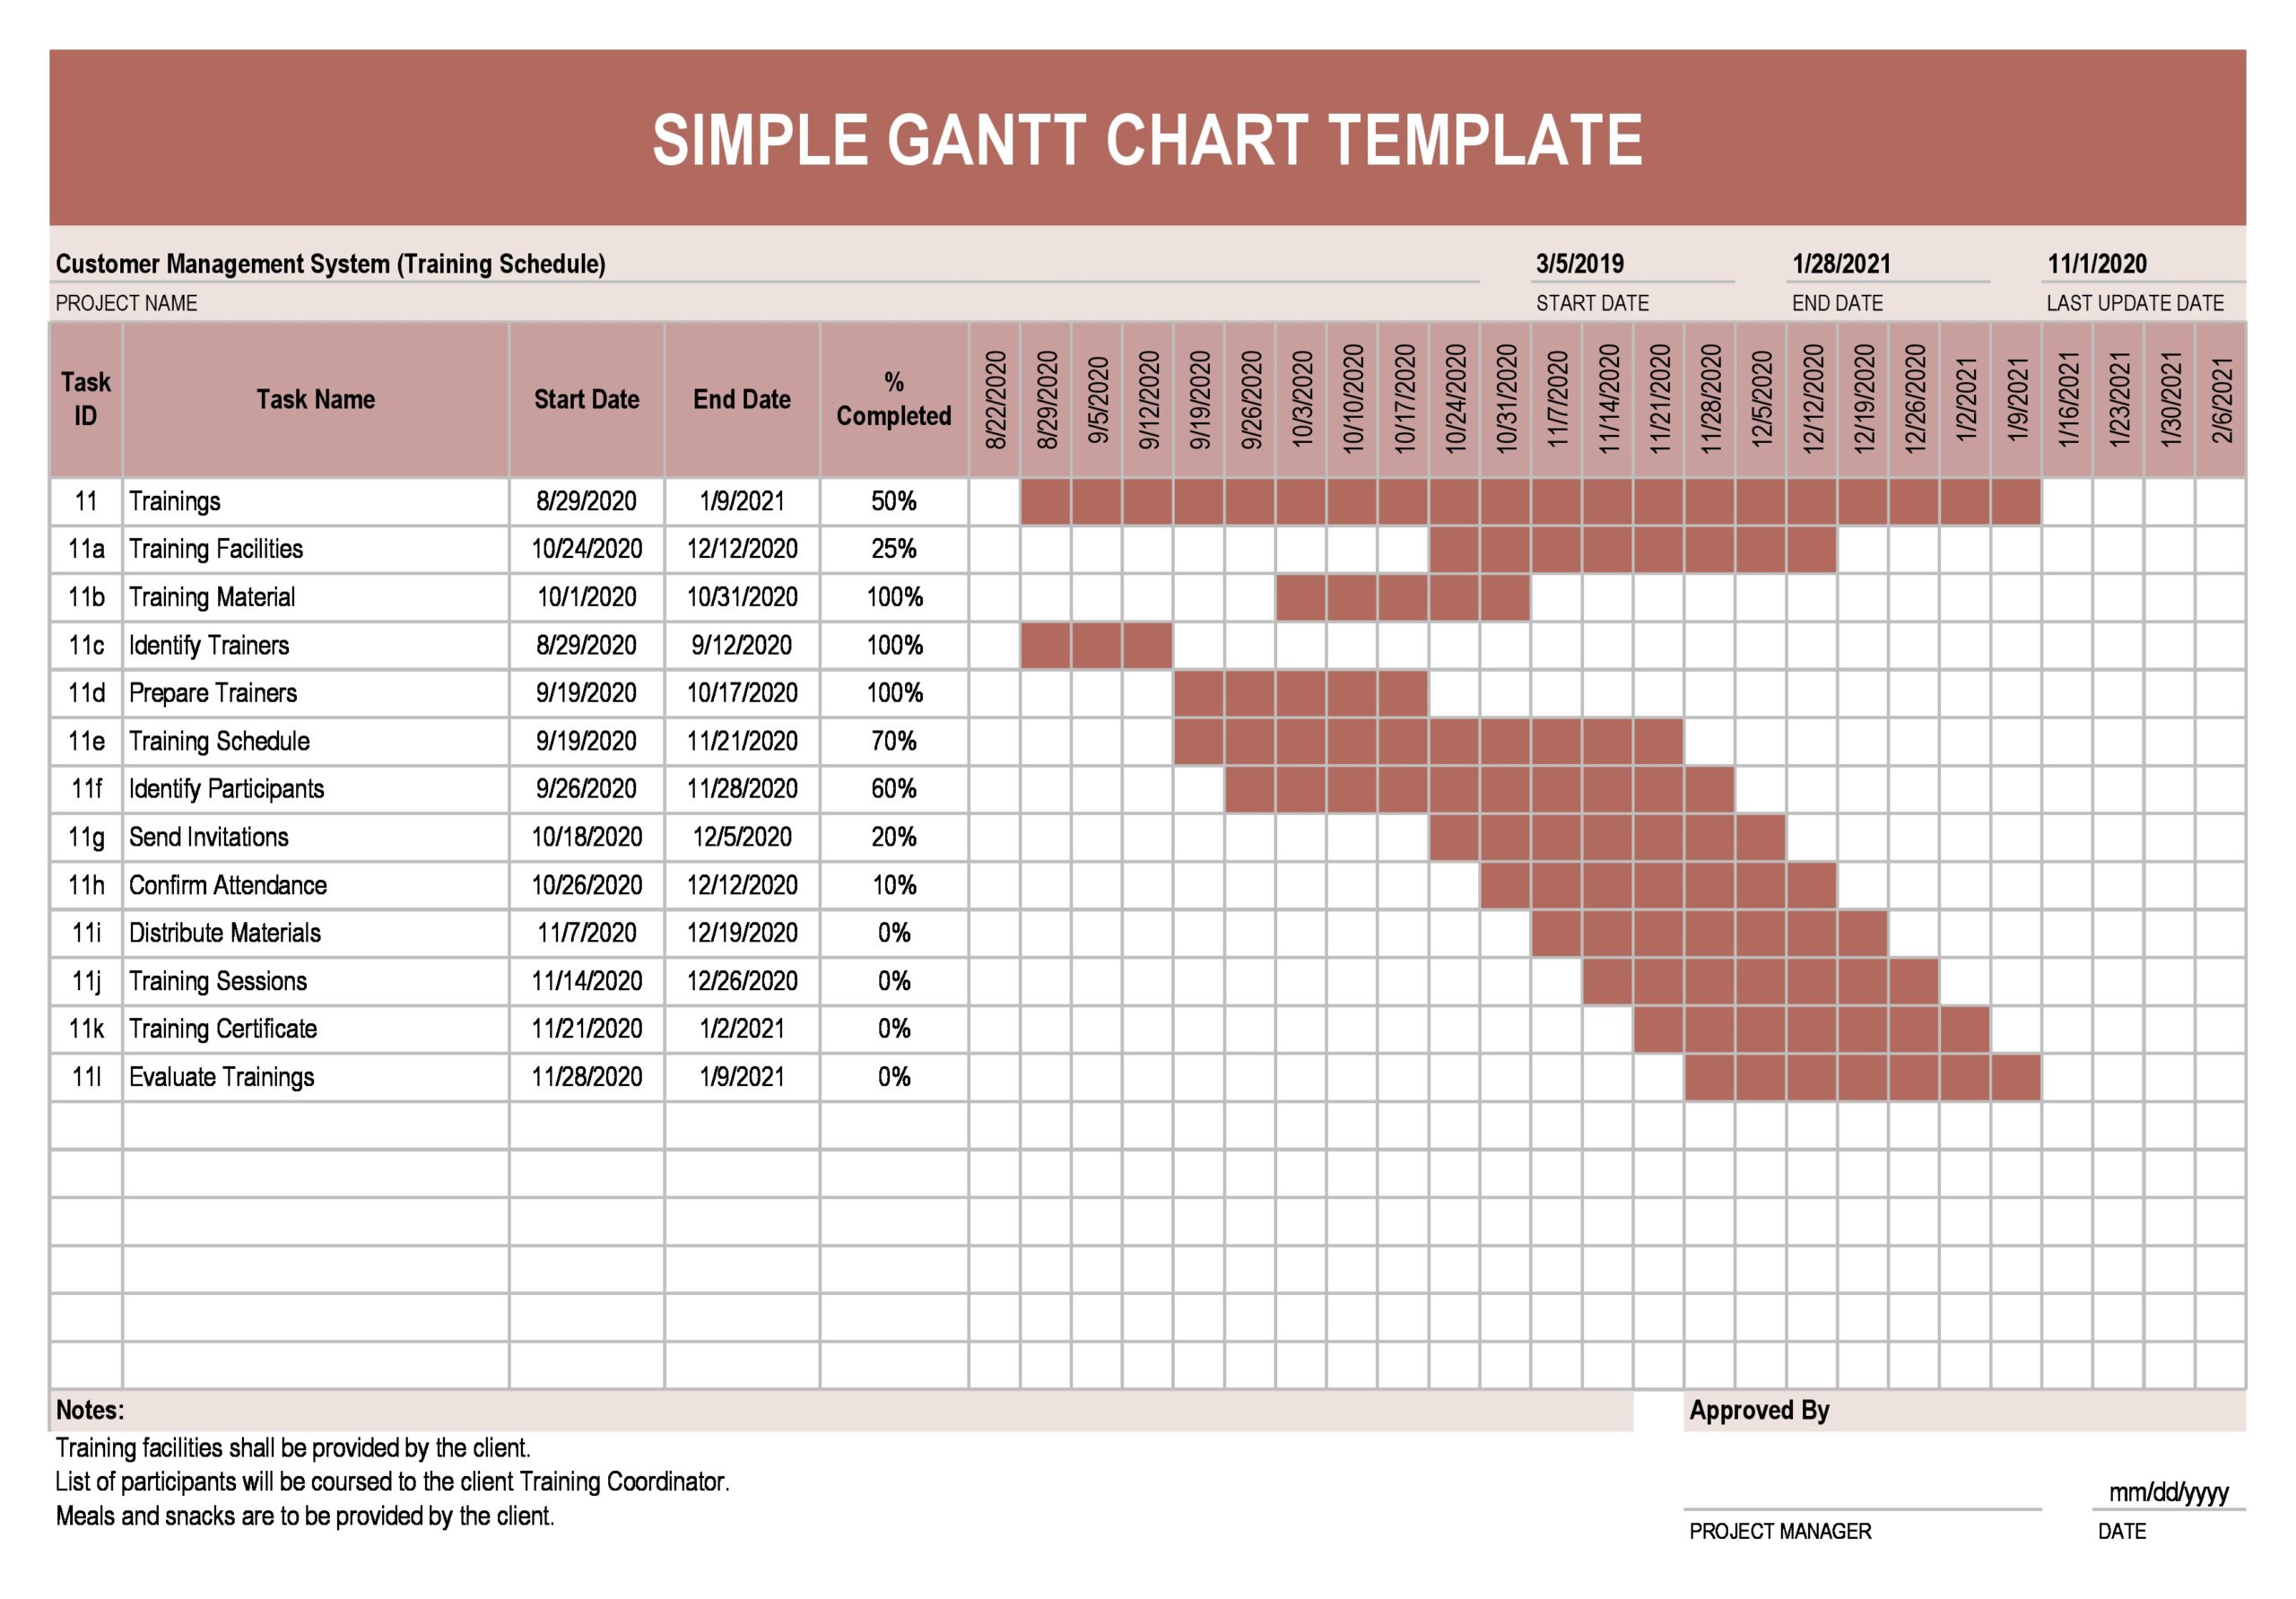
As stated above, typically there would be another column for "Person Responsible"
What Does a Gantt Chart Show?
Let’s break down the basic components of a gantt chart even further so you understand how each element functions in a project plan.
- Task list: Runs vertically down the left of the gantt chart to describe project work and may be organized into groups and subgroups
- Timeline: Runs horizontally across the top of the gantt chart and shows months, weeks, days, and years
- Dateline: A vertical line that highlights the current date on the gantt chart
- Bars: Horizontal markers on the right side of the gantt chart that represent tasks and show progress, duration, and start and end dates
- Milestones: Yellow diamonds (or other markers) that call out major events, dates, decisions, and deliverables
- Dependencies: Light gray lines that connect tasks that need to happen in a certain order
- Progress: Shows how far along work is and may be indicated by percent complete and/or bar shading
- Resource assigned: Indicates the person or team responsible for completing a task
How Does a Gantt Chart Work?
In a gantt chart, all project activities run vertically down the y-axis of the chart, with a timeline running horizontally across the x-axis. Each task listed down the left is represented by a horizontal bar on the right side of the chart.
These taskbars span from start date to end date to show the overall duration of a task.
- As work gets done, each taskbar fills up to indicate the amount of progress completed.
- If one task relies on another one to start or finish, a line will be drawn between the two taskbars to mark a dependency.
- Since project milestones have a 0-day duration, they’re typically represented by a yellow or gold diamond on the gantt chart. Resource assignments are typically listed down the left beside the task name, but may also appear within or next to taskbars on the right side of a gantt chart.
Why are Gantt Charts Used in Project Management?
The purpose of a gantt chart is to communicate a project's big-picture plan so teams and stakeholders know what it will take to deliver it on time and budget—even as work gets underway.
Here are just a few advantages gantt charts bring to project management:
- Visualize your entire project: A gantt chart gives you a start-to-finish view of your entire project timeline so you can see how tasks are progressing in real time. That means you can provide up-to-the-minute status reports to managers and stakeholders in a flash.
- See how tasks are connected: Let’s face it: Things change. Modern gantt charts make it easy to shift tasks around without breaking your stride. With dependencies—a star feature of any gantt chart—you can keep tasks connected even when your timeline gives you the ol’ switcheroo.
- Keep everyone on the same page and on time: Clear communication is a must-have in any project. Without it, you risk project delays and cost overruns. Web-based gantt charts, like TeamGantt, ensure no one’s left in the dark. That’s because all your project info and discussion threads live in one central hub that everyone can access, making team collaboration a breeze.
- Know who’s busy and who isn’t: If you want to make smart business decisions, you’ve got to have a good grasp on your resources. With gantt charts, resource management is no longer a guessing game. You can see who’s got bandwidth to take on new tasks at a glance.